
Define the Question Before Collecting TMR Samples
For useful TMR particle size testing, identify the separator, keep the sampling question consistent, follow its matching procedure and record the mass retained in each fraction. Compare newly delivered feed with newly delivered feed; keep later bunk observations in a separate series. The result is a physical measurement record for review, not proof that the ration is nutritionally balanced. Penn State Extension explains both the measurement method and its limits.
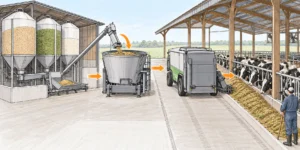
Choose one question for each record: Does fresh delivery differ along the route? Do comparable batches differ? Or does the feed remaining in the bunk change after cows have access? Penn State recommends fresh bunk samples before eating or sorting for the delivered-ration baseline and describes checks at several feeding-route locations.
This guide supplies a field-record format and calculation example for technical staff, feeders and their advisors. For the wider equipment interfaces, start with the dairy farm equipment guide. Use the TMR mixer selection guide when the question concerns machine configuration or commissioning rather than the measurement record.
Prepared for AIG Machinery from the cited extension guidance with AI-assisted research and drafting. No farm trial, clinical assessment or human expert review is claimed.
Identify the Separator and the Applicable Protocol
Inspect the screen apertures rather than identifying the separator by color or the number of boxes alone. The original 1996 Penn State model used 19- and 8-mm sieves; the 2002 model added a 1.18-mm screen. The current 2013 model uses 19-, 8- and 4-mm sieves above a solid pan. Penn State Extension provides tools for the current model and separate resources for earlier versions.
The procedure below is scoped to that current 4-mm model and Penn State publication DSE 2013-186, on the page updated October 6, 2025. Put the screen sizes and source version on the worksheet before collecting results. A fraction retained above 4 mm is not interchangeable with one retained above 1.18 mm.
Keep versions together
Use the procedure, screen labels and calculation tools for the separator actually in use. Do not relabel an older model’s results as current-model results.
Build a Comparable Sampling Record
Use the following as an editorial worksheet, not a validated sampling plan. Agree the collection locations, number of samples and any repeat measurements with the farm’s advisor before the comparison. The sources cited here do not establish one sample count or repeatability tolerance for every farm.
| Record field | Enter before or during the test |
|---|---|
| Question and identity | Fresh-delivery location, batch comparison or later bunk observation; farm, group, ration and batch ID. |
| Collection point and timing | Exact point on the route/bunk; date and clock time; delivery time and elapsed time; whether cows have had access. |
| Method | Operator; separator apertures/version; source procedure/version; scale and mass unit. |
| Results and exceptions | Net feed mass in each fraction; total; calculated percentages; sample ID; method deviations and moisture concerns. |
| Review | Comparison sought; uncertainty; person reviewing the record; action owner and follow-up. |
Keep each sample’s result identifiable. If collection conditions or the method differ, record that difference instead of silently pooling the results. For route-location comparisons, the feed distribution equipment guide provides the transport-and-placement context; it does not set particle-test acceptance limits.
For the initial delivered-ration check, collect fresh feed before cows eat or sort it, as described by Penn State Extension. Keep feed in the condition offered: the method does not call for drying, chopping or otherwise changing it before separation.
Run the Current Penn State Separation Procedure
Use the detailed instructions from Penn State Extension alongside this sequence. An accurate scale is needed for the boxes and feed; record net feed mass rather than box-plus-feed mass.
- Stack the largest screen on top: 19 mm, then 8 mm, then 4 mm, with the solid pan underneath.
- Place approximately 3 pints of forage or TMR on the upper screen, as specified in the Penn State procedure. Preserve the feed’s as-offered condition.
- On a flat surface, shake horizontally five times, then rotate the stack one-quarter turn. Keep vertical movement out of the shaking motion.
- Continue for eight sets of five shakes, rotating after each set: 40 shakes in total. Penn State recommends at least 1.1 shakes per second and an approximately 7-inch stroke, given in the source as 17 cm.
- Weigh the feed retained on each screen and in the bottom pan. Exclude the corresponding empty-box mass and record all four net masses in the same unit.
Wet-sample limitation
Penn State cautions that samples below 45% dry matter may not separate accurately. Record the concern and seek method-specific advice; drying or chopping the sample changes the feed being measured.
The stroke dimensions in the source are approximate equivalents. Retain the source procedure with the test record so the operator can check the intended motion, rather than treating the summary as a substitute for its diagram.
Calculate and Record Retained Fractions

Retained fraction
Retained fraction (%) = net feed mass in that fraction ÷ sum of net feed masses in all four fractions × 100.
This is a mass-based result for the feed as tested. It is not a count of particles or a measurement of nutrient concentration. Penn State Extension demonstrates the calculation with the following retained masses in Table 2.
| Fraction | Net feed mass | Calculation | Retained |
|---|---|---|---|
| 19-mm upper sieve | 10 g | 10 ÷ 200 × 100 | 5% |
| 8-mm middle sieve | 80 g | 80 ÷ 200 × 100 | 40% |
| 4-mm lower sieve | 40 g | 40 ÷ 200 × 100 | 20% |
| Bottom pan | 70 g | 70 ÷ 200 × 100 | 35% |
| Total | 200 g | 10 + 80 + 40 + 70 | 100% |
These are the source’s illustrative inputs, with the arithmetic checked here; they are not farm measurements or a target distribution. If cumulative undersize is needed, subtract successive retained fractions: below the upper sieve is 100 − 5 = 95%; below the middle sieve is 95 − 40 = 55%; below the lower sieve is 55 − 20 = 35%. Label retained and cumulative results separately.
Keep the masses next to the percentages so a reviewer can reproduce the calculation. A percentage total near 100% checks arithmetic and rounding; it does not establish that collection or separation was representative. Retain any repeat result as another identified observation rather than treating arithmetic agreement as a test of the feed.
Separate Delivery Comparisons from Later Bunk Observations
For a location comparison, keep the record tied to fresh delivery and identify the collection point. For a sorting investigation, create a time series tied to the feeding event. UMN Extension describes observations at delivery, later after feeding and before the next feeding. Later feed has been exposed to consumption and sorting, so a change over time answers a different question from a fresh-delivery location difference.
With an automatic feeding system, identify the delivery event associated with each sample. Record clock time and elapsed time rather than writing only “morning” or “afternoon.” This is a record-design choice to make the comparison traceable, not a prescribed sampling interval.
Do not select a universal pass/fail cutoff from these pages. Penn State Extension and UMN Extension give different numerical guidance for changes during sorting observations. They do not clearly establish the same calculation basis. Their published TMR fraction ranges also differ: the current Penn State guidance specifies a 4-mm lower sieve, while the UMN Extension overview does not identify its screen apertures. This guide therefore supplies no interchangeable target table or numerical sorting limit.
Turn the Record into a Nutritionist Review
Send the reviewer the original question, sample identities, source procedure, separator version, retained masses, calculations and exceptions together. Ask whether the comparison is valid and what further information is needed before proposing a change. If the method or sample identity is unclear, resolve that gap before interpreting the percentages.
Particle screening describes physical distribution. Penn State Extension explains that fiber content and digestibility can differ among fractions and that even an estimate of physically effective fiber does not guarantee a balanced diet or correct rumen pH. Similar sieve results alone cannot establish nutrient homogeneity, nutritional adequacy or the cause of a production problem.
Use the result within its limits
Use the record to show what was collected, how it was separated and what mass distribution resulted. Leave ration changes and animal-health interpretation to qualified farm advisors; do not turn a sieve result into a generic mixing-time adjustment or machine-fault diagnosis.
References
- AIG Machinery (aigmachinery.com) — Dairy industry solutions provider offering the equipment context linked in this guide, including whole-farm systems, TMR mixing, feed distribution and automatic feeding interfaces.
- Pennsylvania State University Extension (Penn State Extension) — Provides the separator version history, current 4-mm procedure, retained-mass calculation example and interpretation limits used to structure this sampling and results record.
- University of Minnesota Extension (UMN Extension) — Provides the later-bunk sampling context and comparison guidance examined here; differences from Penn State guidance are retained rather than converted into universal targets.