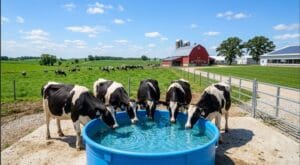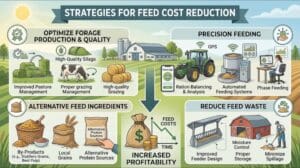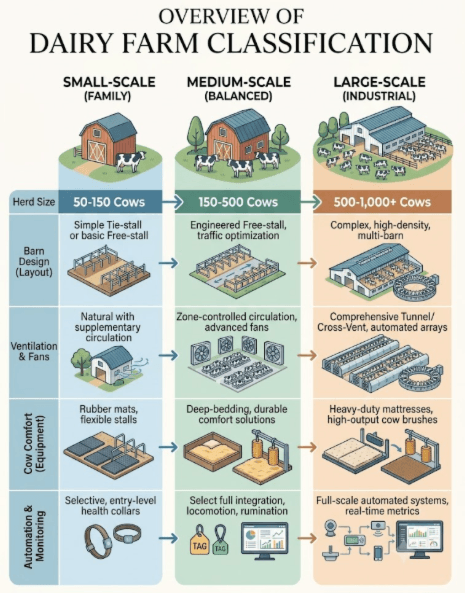
Dairy farms can look completely different even when they produce the same product: milk. A 50-cow family farm may depend on owner labor, simple feeding equipment, and natural ventilation, while a 2,000-cow operation may use large TMR mixers, rotary parlors, automated manure systems, environmental controls, and real-time cow monitoring.
Farm size has also been trending upward in major dairy-producing regions. In the United States, USDA data show that the average dairy farm increased from about 112 cows in 2000 to 283 cows in 2021. Between 2002 and 2022, the number of farms with 1,000 or more cows increased by about 60%, while farms below 1,000 cows declined.
However, larger does not automatically mean better. Each dairy farm scale requires a different balance of labor, equipment, capital, cow comfort, and management.
This article uses the following practical classification:
| Dairy Farm Type | Herd Size Used Here | Automation Level | Main Management Goal | What It Means |
|---|---|---|---|---|
| Small | 1–150 cows | Low | Control cost | Simple and reliable equipment is often more valuable than maximum automation. |
| Medium | 150–500 cows | Medium | Improve labor efficiency | Feeding, milking, and manure handling increasingly need mechanization. |
| Large | 500–1,000+ cows | High | Increase throughput | Equipment capacity, automation, specialized labor, and data management become critical. |
These ranges are working categories for this article rather than universal standards. Dairy farm structure varies significantly by country, production system, climate, land availability, and local economics.
Small-Scale Dairy Farms: 1–150 Cows
Small dairy farms are commonly associated with family labor, simpler facilities, and lower levels of automation. The owner may be directly involved in feeding, milking, cleaning, breeding decisions, calf management, and equipment maintenance.
The advantage is flexibility. The disadvantage is that production can become highly dependent on human labor.
| Area | Typical Small-Farm Approach | Main Advantage | Main Limitation |
|---|---|---|---|
| Labor | Owner/family + limited employees | Lower payroll requirement | Heavy dependence on individual workers |
| Feeding | Manual, tractor-fed or small TMR mixer | Lower investment | More labor per cow |
| Milking | Bucket, pipeline or small parlor | Simple operation | Limited throughput |
| Manure | Manual or basic mechanical system | Lower capital cost | Labor increases as herd expands |
| Barn | Tie-stall/basic free-stall | Simple construction | Expansion may be difficult |
| Monitoring | Visual observation | Low equipment cost | Requires frequent human observation |
| Automation | Limited | Low capital requirement | Lower labor productivity |
Feeding and Milking on Small Farms
A farm with 50 cows can often tolerate processes that become impractical with 500 cows.
For example, assume a lactating group consumes an average of 22 kg of dry matter per cow per day for a planning exercise. Actual intake must be formulated according to production level, body weight, lactation stage, ration composition, environment, and nutritionist recommendations. University of Minnesota guidance shows postpartum dry-matter intake targets of at least 34 lb/day for first-lactation cows and 42 lb/day for multiparous cows, while intake varies substantially across production groups.
Using 22 kg DM merely as a calculation assumption:
| Herd Size | Assumed DM/Cow/Day | Total DM Needed | At 50% Ration DM* | Practical Meaning |
|---|---|---|---|---|
| 50 cows | 22 kg | 1,100 kg | 2.2 t as-fed | Small feeding equipment may handle the ration in one or a few loads. |
| 100 cows | 22 kg | 2,200 kg | 4.4 t as-fed | A small TMR mixer becomes much easier to justify. |
| 150 cows | 22 kg | 3,300 kg | 6.6 t as-fed | Mixer capacity and feeding time start becoming important operational variables. |
*50% ration dry matter is an example assumption, not a universal ration specification.
This explains why equipment should be selected from feed weight and required batches, rather than cow numbers alone.
Barn Design and Cow Comfort
Small farms do not need to ignore cow comfort simply because they have fewer cows.
| System | Typical Solution | Important Target | Practical Meaning |
|---|---|---|---|
| Housing | Tie-stall/basic free-stall | Correct dimensions for cow size | Cows need enough room to lie and rise normally. |
| Resting | Bedding or mats | About 10–14 h lying opportunity/day | Excessive standing increases hoof and welfare concerns. |
| Feed access | Accessible feed bunk | Feed available most of the day | Reduces competition and interrupted intake. |
| Water | Troughs/drinkers | Continuous clean water | Milk production creates high water demand. |
| Cooling | Natural ventilation + fans | Prevent heat accumulation | Fans can target feeding and resting areas. |
University of Minnesota notes that dairy cows generally seek roughly 12–14 hours of lying time per day, and recommends enough stall space for approximately 10–14 hours of lying and rumination.
Basic dairy barn design, adequate bedding, water access, dairy barn ventilation, and strategically positioned dairy barn fans can therefore be more important than expensive automation.
Medium-Scale Dairy Farms: 150–500 Cows
The transition from 150 cows toward 500 cows often changes the economics of the operation.
A task requiring only one hour on a small farm can become several hours when herd size triples. At this stage, mechanization is no longer simply convenient—it can become essential for maintaining consistent feeding, milking, cleaning, and cow observation.
How Scale Changes Daily Feed Demand
Using the same 22 kg DM/cow/day planning assumption:
| Herd Size | DM Required/Day | Example As-Fed Ration at 50% DM | 8-t Usable Mixer Loads* | What It Means |
|---|---|---|---|---|
| 100 | 2.2 t | 4.4 t | 1 | One daily load may theoretically cover the group. |
| 300 | 6.6 t | 13.2 t | 2 | Multiple loads become necessary. |
| 500 | 11.0 t | 22.0 t | 3 | Loading speed and feed delivery scheduling matter. |
| 1,000 | 22.0 t | 44.0 t | 6 | Feeding becomes a major production process. |
*Calculated example assuming an 8-ton usable as-fed load. Actual mixer usable capacity depends on mixer volume, ration density, fill level, manufacturer specifications, ration structure, and number of feeding groups.
The lesson is straightforward: a mixer that technically works for 100 cows may become a serious bottleneck at 500 cows.
Equipment for a 150–500 Cow Dairy Farm
| Equipment | Typical Role | Useful Capacity Indicator | Why It Matters |
|---|---|---|---|
| TMR Mixer | Mix complete ration | t/load or m³/load | Determines daily number of feeding cycles |
| Feed Wagon | Deliver feed | t/load | Influences feeding time |
| Feed Pusher | Keep ration accessible | Pushes/day | Reduces repeated tractor/manual work |
| Milking Parlor | Central milking | cows/hour | Determines total milking duration |
| Manure Scraper | Clean alleys | cycles/day | Reduces repetitive cleaning |
| Barn Fans | Cooling | airflow/air speed | Helps control heat stress |
| Cow Sensors | Monitor cows | cows/device/system | Supports large-group management |
University of Minnesota recommends feed availability for transition cows for at least 23 hours/day, with feed push-up about every four hours in its management benchmarks.
That does not mean every farm must automatically push feed every four hours, but it illustrates why regular feed access becomes increasingly difficult to manage manually as herd size grows.
Water Demand Grows Quickly with Herd Size
Water infrastructure is one of the easiest requirements to underestimate when expanding a dairy.
Penn State Extension reports that a lactating dairy cow may consume approximately 30–50 gallons (114–189 liters) of water per day, with demand potentially increasing substantially during heat stress.
Applying that range:
| Milking Cows | Drinking Water/Cow | Herd Water/Day | Approx. m³/Day | Practical Meaning |
|---|---|---|---|---|
| 100 | 30–50 gal | 3,000–5,000 gal | 11–19 m³ | Even a small commercial herd needs reliable water capacity. |
| 300 | 30–50 gal | 9,000–15,000 gal | 34–57 m³ | Pipe size, trough refill rate, and well capacity become important. |
| 500 | 30–50 gal | 15,000–25,000 gal | 57–95 m³ | Multiple drinking points and reserve capacity may be needed. |
| 1,000 | 30–50 gal | 30,000–50,000 gal | 114–189 m³ | Water becomes major farm infrastructure. |
These figures cover cow drinking water, not total farm water use. Milking-center cleaning, equipment washing, cooling systems and other uses can add substantially more.
Medium Farms Need Better Environmental Control
As stocking density and barn dimensions increase, relying entirely on natural airflow can become less reliable.
Heat stress is especially important. University of Minnesota notes that heat stress reduces dry-matter intake, milk production and pregnancy rates and can increase disease and lameness risks.
Penn State notes that lactating and dry dairy cattle can begin experiencing heat stress around a THI of 68.
| Indicator | Useful Reference | What Farmers Should Understand |
|---|---|---|
| THI | Around 68+ can indicate heat-stress risk | Temperature alone does not describe cow heat load. |
| Water consumption | 30–50 gal/cow/day under normal lactating conditions | Water infrastructure must be sized for peak demand. |
| Lying time | Roughly 12–14 h/day desired | Poor stalls or heat stress can increase standing. |
| Feed availability | Up to 23 h/day benchmark for transition cows | Feed management matters beyond simply delivering one ration. |
For medium farms, dairy barn ventilation, well-positioned dairy barn fans, sufficient water access, comfortable stalls, and reliable bedding management become an integrated system rather than separate accessories.
Large-Scale Dairy Farms: 500–1,000+ Cows
Once a dairy reaches several hundred or several thousand cows, the operating philosophy changes.
The manager can no longer personally observe every cow several times per day. Equipment downtime can affect hundreds of animals, and even a small delay in feeding or milking can accumulate into many labor hours.
Large farms therefore tend to focus on:
- process standardization,
- equipment throughput,
- cow grouping,
- specialized employees,
- preventive maintenance,
- automated data collection,
- and system redundancy.
USDA research reflects the structural shift toward larger farms. USDA ERS reports that operations with more than 1,000 cows accounted for a majority of U.S. milk production in earlier structural analyses, and recent USDA research continues to find lower production costs per unit of milk, on average, among larger dairy farms—although profitable farms exist in every size category.
What Happens at 1,000 Cows?
Using the same illustrative ration assumptions:
| Daily Requirement | 100 Cows | 500 Cows | 1,000 Cows | Scale Effect |
|---|---|---|---|---|
| Dry Matter | 2.2 t | 11 t | 22 t | Feed storage and inventory become major management issues. |
| As-Fed TMR at 50% DM | 4.4 t | 22 t | 44 t | Mixer loading becomes a full production process. |
| 8-t Mixer Loads | 1 | 3 | 6 | Equipment utilization rises quickly. |
| Drinking Water | 11–19 m³ | 57–95 m³ | 114–189 m³ | Water supply becomes critical infrastructure. |
These are calculated examples, not universal performance standards.
Milking Throughput Becomes a Bottleneck
Milking systems should be selected from the amount of work that must be completed within an acceptable time window.
For example, if every cow is milked three times daily and management wants each milking round completed within three hours:
| Herd Size | Cows per Milking | Desired Milking Window | Minimum Theoretical Throughput* |
|---|---|---|---|
| 100 | 100 | 3 h | 33 cows/h |
| 300 | 300 | 3 h | 100 cows/h |
| 500 | 500 | 3 h | 167 cows/h |
| 1,000 | 1,000 | 3 h | 333 cows/h |
| 2,000 | 2,000 | 3 h | 667 cows/h |
*Simple calculation: herd size ÷ desired milking hours. It does not include cleaning, group movement, downtime, treatment cows, parlor turns, attachment efficiency or system losses.
This is why a milking system should be sized from required throughput, not simply from the number of stalls advertised by a manufacturer.
Equipment Requirements by Dairy Farm Size
| Equipment | 1–150 Cows | 150–500 Cows | 500–1,000+ Cows | Selection Logic |
|---|---|---|---|---|
| Feeding | Manual/small TMR | Dedicated TMR | High-capacity TMR/central feeding | Match daily ration to loads and feeding groups. |
| Milking | Pipeline/small parlor | Herringbone/parallel | Large parallel/rotary/robotic | Calculate cows/hour first. |
| Feed Pushing | Manual/tractor | Tractor/automatic | Automatic | Repetitive labor grows with scale. |
| Manure | Manual/basic scraper | Mechanical scraper | Automated/high-capacity | Size from actual manure + wash-water volume. |
| Ventilation | Natural + basic fans | Zoned mechanical cooling | Engineered system | Larger barns require more uniform environmental control. |
| Cow Comfort | Basic bedding/stalls | Improved bedding and stall systems | Engineered group-specific facilities | Resting time remains important at every scale. |
| Monitoring | Visual | Selected sensors | Integrated smart cow monitoring | Human observation becomes more difficult as herd size increases. |
| Management | Paper/basic software | Herd software | Integrated platforms | Data volume rises rapidly with herd size. |
Smart Cow Monitoring Becomes More Valuable as Herds Grow
A farmer with 50 cows may notice a cow behaving differently simply because they see her every day. Doing the same thing consistently across 2,000 cows is much harder.
This is where smart cow monitoring becomes useful.
University of Minnesota research has examined rumination, activity, feeding and standing behavior as potential indicators for identifying transition-cow disorders. In one study involving 296 sensor-equipped cows, cows diagnosed with metritis showed lower rumination after calving than unaffected cows.
| Farm Task | Traditional Method | Smart/Automated Method | Main Benefit |
|---|---|---|---|
| Heat detection | Visual observation | Activity sensors | Continuous monitoring |
| Rumination | Occasional observation | Rumination collar | Individual daily data |
| Cow identification | Ear-tag reading | RFID | Faster identification |
| Health screening | Worker observation | Behavior alerts | Earlier investigation |
| Feed pushing | Tractor/manual | Automatic pusher | Lower repetitive labor |
| Manure cleaning | Tractor/manual | Automatic scraper | Consistent cleaning cycles |
| Records | Paper/spreadsheet | Integrated software | Easier analysis across large herds |
Technology should support—not replace—experienced stockmanship and veterinary decision-making.
Small vs. Medium vs. Large Dairy Farms: Complete Comparison
| Factor | Small: 1–150 | Medium: 150–500 | Large: 500–1,000+ | Why It Matters |
|---|---|---|---|---|
| Labor Model | Family/limited staff | Mixed workforce | Specialized teams | Labor structure changes with complexity. |
| Feeding | Manual/small mixer | Mechanized TMR | High-capacity/automated | Feed consistency becomes harder at scale. |
| Milking | Basic/small parlor | Dedicated parlor | Large parlor/rotary/robotic | Throughput must keep pace with herd size. |
| Manure Handling | Basic | Mechanical | Automated | Daily material volume grows rapidly. |
| Barn Design | Simple | Optimized free-stall | Engineered high-capacity | Cow and machinery traffic becomes critical. |
| Ventilation | Natural/basic fans | Mechanical support | Engineered cooling | Uniform conditions are harder to maintain in large barns. |
| Cow Monitoring | Visual | Sensors for selected groups | Integrated monitoring | Individual observation becomes harder. |
| Automation | Low | Medium | High | Labor-saving economics improve with utilization. |
| Capital Need | Lower | Moderate | High | Larger farms carry greater financial exposure. |
| Management Complexity | Lower | Medium | High | Scale requires specialization and systems. |
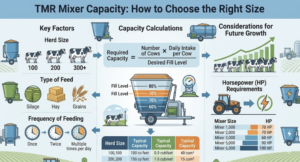
How to Choose a TMR Mixer by Farm Size
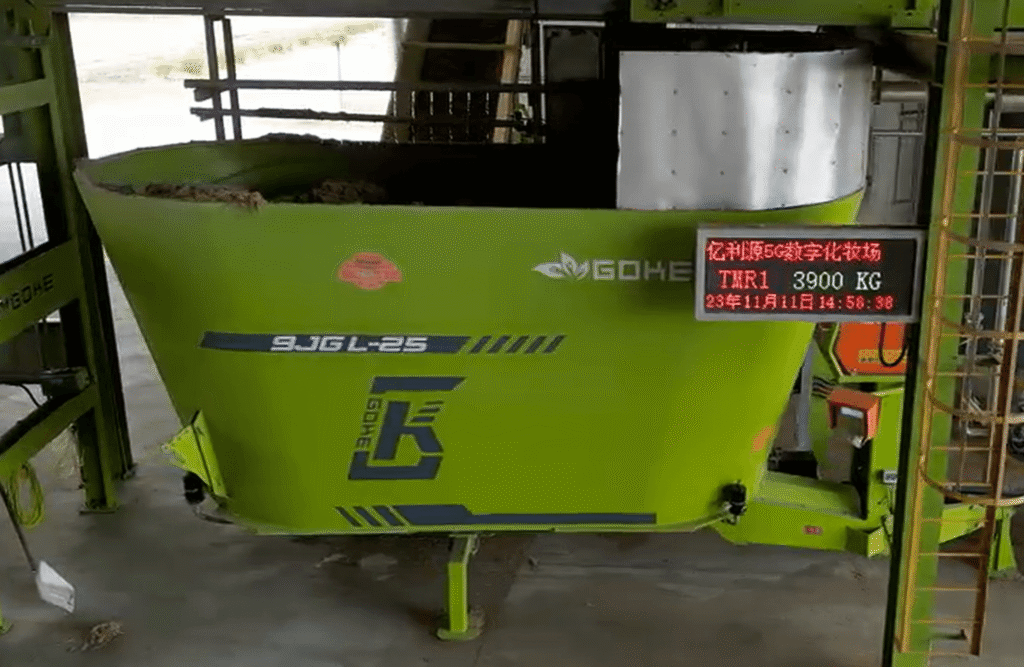
Cow numbers alone are not enough.
A better calculation is:
Daily as-fed ration ÷ usable mixer load = mixer loads per day
For example:
| Herd | Assumed As-Fed Feed | Example Usable Mixer Load | Loads/Day | Practical Interpretation |
|---|---|---|---|---|
| 100 | 4.4 t/day | 8 t | 1 | Mixer has substantial spare capacity. |
| 300 | 13.2 t/day | 8 t | 2 | Reasonable workload before considering groups. |
| 500 | 22 t/day | 8 t | 3 | Loading and distribution time become important. |
| 1,000 | 44 t/day | 8 t | 6 | A larger mixer or multiple units may improve workflow. |
But this is only the first calculation.
A 1,000-cow farm may have high-producing cows, fresh cows, late-lactation cows, dry cows and replacement heifers requiring different rations. University of Minnesota specifically recommends grouping cows according to production and physiological stage when managing TMR programs.
Therefore:
1,000 cows ≠ one 1,000-cow ration.
The number of feeding groups can matter almost as much as total herd size.
Key Factors Before Expanding a Dairy Farm
| Factor | Number to Calculate | Key Question | Why It Matters |
|---|---|---|---|
| Feed | t/day | Can current storage and mixing equipment supply the expanded herd? | Feed is handled every day. |
| TMR | loads/day | Will the mixer become a bottleneck? | Too many batches increase labor and equipment hours. |
| Milking | cows/hour | Can all cows be milked within the target window? | Parlor capacity controls daily scheduling. |
| Labor | cows/worker | Can additional cows be managed without proportional hiring? | Determines automation value. |
| Water | L/day | Can wells, pipes and troughs meet peak demand? | Water intake rises sharply with herd size. |
| Manure | m³/day | Can storage and handling systems manage expansion? | Infrastructure is expensive to retrofit. |
| Barn | cows/pen | Is there enough resting and feeding space? | Overstocking can reduce cow comfort. |
| Capital | $/cow | What is the additional investment per cow? | Expansion must generate adequate return. |
Which Dairy Farm Size Is More Profitable?
There is no single answer.
USDA reports that larger dairy farms generally have lower costs per unit of milk produced, reflecting economies of scale, but it also emphasizes that profitable farms can be found across herd-size categories.
The correct question is therefore not:
“How many cows should I have?”
It is:
“At what herd size can my farm produce milk most efficiently with the resources I have?”
| Profitability Indicator | Small Farm | Medium Farm | Large Farm |
|---|---|---|---|
| Initial Capital | Lower | Medium | High |
| Labor/Cow | Usually higher | Improving | Potentially lower |
| Equipment Utilization | Lower | Higher | High |
| Purchasing Scale | Limited | Moderate | Stronger |
| Management Complexity | Lower | Medium | High |
| Financial Exposure | Lower | Medium | High |
| Economies of Scale | Limited | Moderate | Stronger |
| Flexibility | High | Medium–High | Lower |
Profitability should ultimately be measured using indicators such as:
- milk production cost per kg/liter,
- feed cost per kg of milk,
- labor cost per cow,
- cows managed per worker,
- margin per cow,
- equipment utilization,
- debt servicing capacity,
- and return on invested capital.
A 100-cow farm with strong margins can be healthier financially than a poorly managed 2,000-cow farm.
From Small Dairy Farms to Smart Dairy Farms
The development of a dairy operation can be viewed as a progression:
Manual → Mechanized → Semi-Automated → Automated → Data-Driven
| Stage | Feeding | Milking | Manure | Cow Monitoring | Management |
|---|---|---|---|---|---|
| Manual | Manual | Basic | Manual | Visual | Paper |
| Mechanized | TMR mixer | Parlor | Scraper | Visual/basic | Computer |
| Semi-Automated | Mechanized feeding | Advanced parlor | Automated scraper | Sensors | Herd software |
| Automated | Automated feeding | Rotary/robotic | Automated | Continuous | Integrated systems |
| Smart Dairy | Precision feeding | Data-integrated | Sensor-controlled | Real-time | Data/AI-assisted |
A smart dairy farm is not defined simply by the number of cows.
A 300-cow farm can use sophisticated technology, while a 1,000-cow farm may still rely heavily on conventional equipment.
The real objective is to improve:
output per cow + cows per worker + feed efficiency + equipment utilization + cow health + return on capital.
Frequently Asked Questions
How many cows are considered a small dairy farm?
There is no universal global definition. For practical comparison in this guide, farms with 1–150 cows are classified as small. The definition can vary substantially by country and production system.
What is considered a medium-sized dairy farm?
This article uses 150–500 cows as a working range. At this scale, mechanized feeding, dedicated milking facilities, manure handling, cooling systems and herd-management technology become increasingly important.
How many cows does a large dairy farm have?
For this guide, 500–1,000+ cows represents the large-scale category. In practice, modern commercial dairies may contain several thousand or even tens of thousands of cows.
What equipment does a 100-cow dairy farm need?
A typical 100-cow operation may prioritize milking equipment, feed preparation or a small TMR mixer, water systems, manure handling, ventilation, basic cow comfort equipment, and appropriate feed storage.
What equipment does a 500-cow dairy farm need?
A 500-cow farm generally requires substantially greater mechanization, including a dedicated TMR mixer, feed-delivery equipment, milking parlor, mechanical manure handling, dairy barn fans, reliable water infrastructure and potentially smart cow monitoring.
At what herd size does automation become economical?
There is no universal cow number. Automation should be evaluated from labor hours saved × labor cost, equipment utilization, maintenance cost, financing cost and expected service life. The same machine may generate an attractive ROI on one 300-cow farm and a poor ROI on another.
Are large dairy farms more profitable?
Not automatically. USDA research indicates that larger farms generally have lower average production costs per unit of milk, but profitable and unprofitable operations exist across farm sizes.
Conclusion
| Farm Scale | Main Strength | Main Challenge | Equipment Strategy | Management Priority |
|---|---|---|---|---|
| Small | Flexibility | Labor dependence | Essential equipment first | Cost control |
| Medium | Balance of scale and flexibility | Mechanization transition | Mechanize bottlenecks | Labor efficiency |
| Large | Economies of scale | Capital and complexity | Capacity + automation + integration | Process consistency |
The most successful dairy farm is not necessarily the largest.
Small farms benefit from flexibility and simpler management. Medium farms often gain the most from carefully targeted mechanization. Large farms depend on high-throughput equipment, specialized management, efficient dairy barn design, environmental control, automation, and reliable data.
Regardless of herd size, the same principle applies:
Match the cows, labor, feeding capacity, milking throughput, housing, manure system, water supply and equipment to one another.
When those systems are properly balanced, increasing dairy farm size can create economies of scale. When they are not, expansion can simply create larger bottlenecks and higher costs.